


This summer we wrote a newsletter including some statistics about the local economy. In particular detail, we wanted to look at workforce numbers and housing numbers. Workforce and housing are at the top of everyone’s concerns at the moment, and we received positive feedback about providing some statistics to the community. We’re going to begin reviewing these each fiscal quarter to track the health of our local economy.
Defining the Region
Before we get into the statistics, we need to explain to you what counties we are looking at, and why. We are looking at all the counties touching Tuscarawas County, and we have added Wayne County and Muskingum County to our stat region. We’ve added these counties because of their comparable qualities and data points.

Wayne County and Muskingum County both offer us a much better comparison of our own economic performance because they’re similar in population, as well as median income. According to census.gov, each county’s individual median income is respectively as follows: Tuscarawas County, $28,802, Wayne County, $30,173, and Muskingum County, $26,211. We have some graphics below breaking down our stat region’s population, which should always be taken into consideration when looking at economic markers. As the chart illustrates, Tuscarawas County’s population is more comparable to Wayne County, and Muskingum County, than others in our region.

Workforce Participation Rate
An important indicator of our workforce is the Workforce Participation Rate tracked by the Bureau of Labor Statistics. This is defined by Investopedia as follows:
The labor force participation rate is an estimate of an economy’s active workforce. The formula is the number of people ages 16 and older who are employed or actively seeking employment, divided by the total non-institutionalized, civilian working-age population.
According to Investopedia, this differs from the unemployment rate as explained below:
The key difference between the two is the participation rate measures the percentage of Americans who are in the labor force, while the unemployment rate measures the percentage within the labor force that is currently without a job.
We looked at the spring numbers for the local Workforce Participation Rate this summer, and measured that against our current rate.

We also looked at how we stacked up against the surrounding counties for the month of September.

Wayne County and Muskingum County respectively have the most similar labor participation rate to Tuscarawas County.
Unemployment Rate
As we previously discussed, another metric used to determine the workforce is the Unemployment Rate. Investopedia gives more insight into how this number is calculated differently than the Workforce Participation Rate.
Many people who want to work but cannot (due to a disability, for example) or became discouraged after looking for work without success, are not considered unemployed under this definition; since they are not employed either, they are categorized as outside the labor force.
The Unemployment Rate is defined by Investopedia as follows:
The unemployment rate is the percentage of the labor force without a job. It is a lagging indicator, meaning that it generally rises or falls in the wake of changing economic conditions, rather than anticipating them. When the economy is in poor shape and jobs are scarce, the unemployment rate can be expected to rise. When the economy grows at a healthy rate and jobs are relatively plentiful, it can be expected to fall
Due to the Unemployment Rate being an indicator of changing economic conditions, we have traced the Unemployment Rate through all three fiscal quarters of 2022 below:

We have also isolated Wayne County and Muskingum County to get a better idea of how we fair against counties of similar economic makeup.
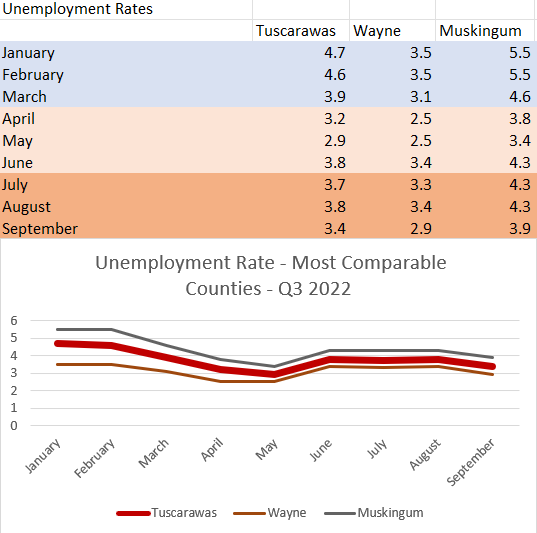
The lower the Unemployment Rate, the better that is for the health of our local workforce. Tuscarawas County fares better than most of the surrounding counties and is neither the best nor worst when looking at the most comparable counties in the region.
Real Estate Sales
The number of Sold Listings in an area is a housing market indicator because it tracks the volume of deals closing in a given time span. With interest rates rising, and continuing to rise, we expect for this number to be suppressed at some point in the near future. However, thus far, the number of Sold Listings in the region is within the 12-month average and though we have signs of this number decreasing, so far, we are not seeing a lack of Real Estate Sales in the area.

Note Stark County makes up 45% of the region we are looking at, with a population of 373, 834. Real Estate Sales volume is going to be reflective of the overall population of a county.
To get a better understanding of how well Tuscarawas County is faring in Real Estate Sales Volume we compared it with numbers from Muskingum County and Wayne County.

Property Values
Property Value is a metric that can be used to look at the cost of living in a region. It’s also a metric used to look at the overall economic health of an area. In 2008, the Great Financial Crisis (GFC) was connected to a major and rapid decline in property values across the nation. This led to many changes in Real Estate lending practices and regulations. Looking at property values can help us understand the affordability of an area, but it can also help us understand if we have any looming issues around our housing market. Investopedia defines Property Value as follows:
The present worth of future benefits arising from the ownership of the property. Unlike many consumer goods that are quickly used, the benefits of real property are generally realized over a long period of time.
In order to track property value, one way we can do this is by looking at the average sales price in the market. By averaging the sales prices and tracking them over time, we can measure whether the demand for housing is increasing or decreasing. Please keep in mind, more than supply and demand of inventory can have an impact on this number. Rising and falling interest rates, as well as stricter credit requirements, have an impact on the number of active willing buyers in the market, and this in addition to the number of listings in inventory available, can all have an impact on average sales prices and subsequently property value. Please also keep in mind, how much any individual property is worth, is defined only by what someone is willing to pay for it on the market.

The Average Sales Prices of Homes in the 3rd quarter continually rose in Tuscarawas County. Other counties in the region are seeing property value declines month-to-month but are not less than the running 12-month average.

We can take a closer look at Tuscarawas County’s performance by looking at the Average Sales Price of Homes for counties more comparable to ours in size and population. Once again, we find Tuscarawas is outperforming Muskingum County but has a slightly less than average home price to Wayne County. From August to September, Wayne County saw a decline in average price, while Tuscarawas has seen an increase, bringing the gap between the counties closer together.
If you have statistics or numbers that you would like to see added to our quarterly look at the State of the Local Economy, please feel free to let us know by emailing marketing@tuscedc.com or jcshively@tuscedc.com. We’re also gearing up to publish another episode of “The Valley Podcast” soon, stay tuned so you don’t miss that!